
Merchant Account Reporting and Analytics: Turning Payment Data into Growth in 2026
Published:

What if your monthly processing statement wasn’t just a bill, but a roadmap to recapturing 3% of your annual revenue? With average processing fees for small businesses hovering between 2.6% and 3.2% in 2026, simply accepting the cost of doing business is no longer a viable strategy. Modern merchant account reporting and analytics have evolved from simple digital receipts into powerful growth engines that can predict a customer’s departure before they even realize they’re leaving.
It’s frustrating to watch hidden fees eat into your margins or spend hours trying to reconcile sales across multiple channels. You aren’t alone in feeling that your payment data is a black box. This guide will show you how to master the metrics that matter, from navigating the new Illinois Interchange Fee Prohibition Act to utilizing predictive tools like ChurnIQ™ for better retention. We’ll show you how to use advanced analytics to eliminate unnecessary costs and build a clear view of your omni-channel performance. You’re about to turn your payment processor into the smartest part of your business operations.
Key Takeaways
- Discover how real-time digital dashboards have replaced static monthly statements to provide a dynamic, live view of your entire transaction lifecycle.
- Learn to calculate your true effective rate and monitor chargeback health using modern merchant account reporting and analytics tools.
- Move beyond historical data by leveraging predictive insights like ChurnIQ™ to identify at-risk customers and prevent churn before it happens.
- Understand how a smart pricing engine uses granular reporting to maintain automated, state-by-state compliance for surcharge and dual pricing programs.
- Explore how ISOs and partners can scale their operations by automating complex residual compensation through ClearSplit™ partner analytics.
Table of Contents
- What is Merchant Account Reporting and Why Does It Matter?
- Key Performance Indicators (KPIs) Every Merchant Should Track
- Advanced Analytics: Moving Beyond Static Dashboards
- Reporting for Surcharge and Dual Pricing Compliance
- Strictly: The Future of Payment Intelligence for Merchants and ISOs
What is Merchant Account Reporting and Why Does It Matter?
At its core, merchant reporting is the systematic tracking of the entire transaction lifecycle. It isn’t just a list of sales; it’s a granular record of every data point generated from the second a customer initiates a payment until those funds are settled in your bank. Understanding the nuances of merchant account reporting and analytics is no longer optional for businesses that want to protect their margins. While your Merchant account provides the ability to accept payments, the reporting layer provides the intelligence to manage them profitably.
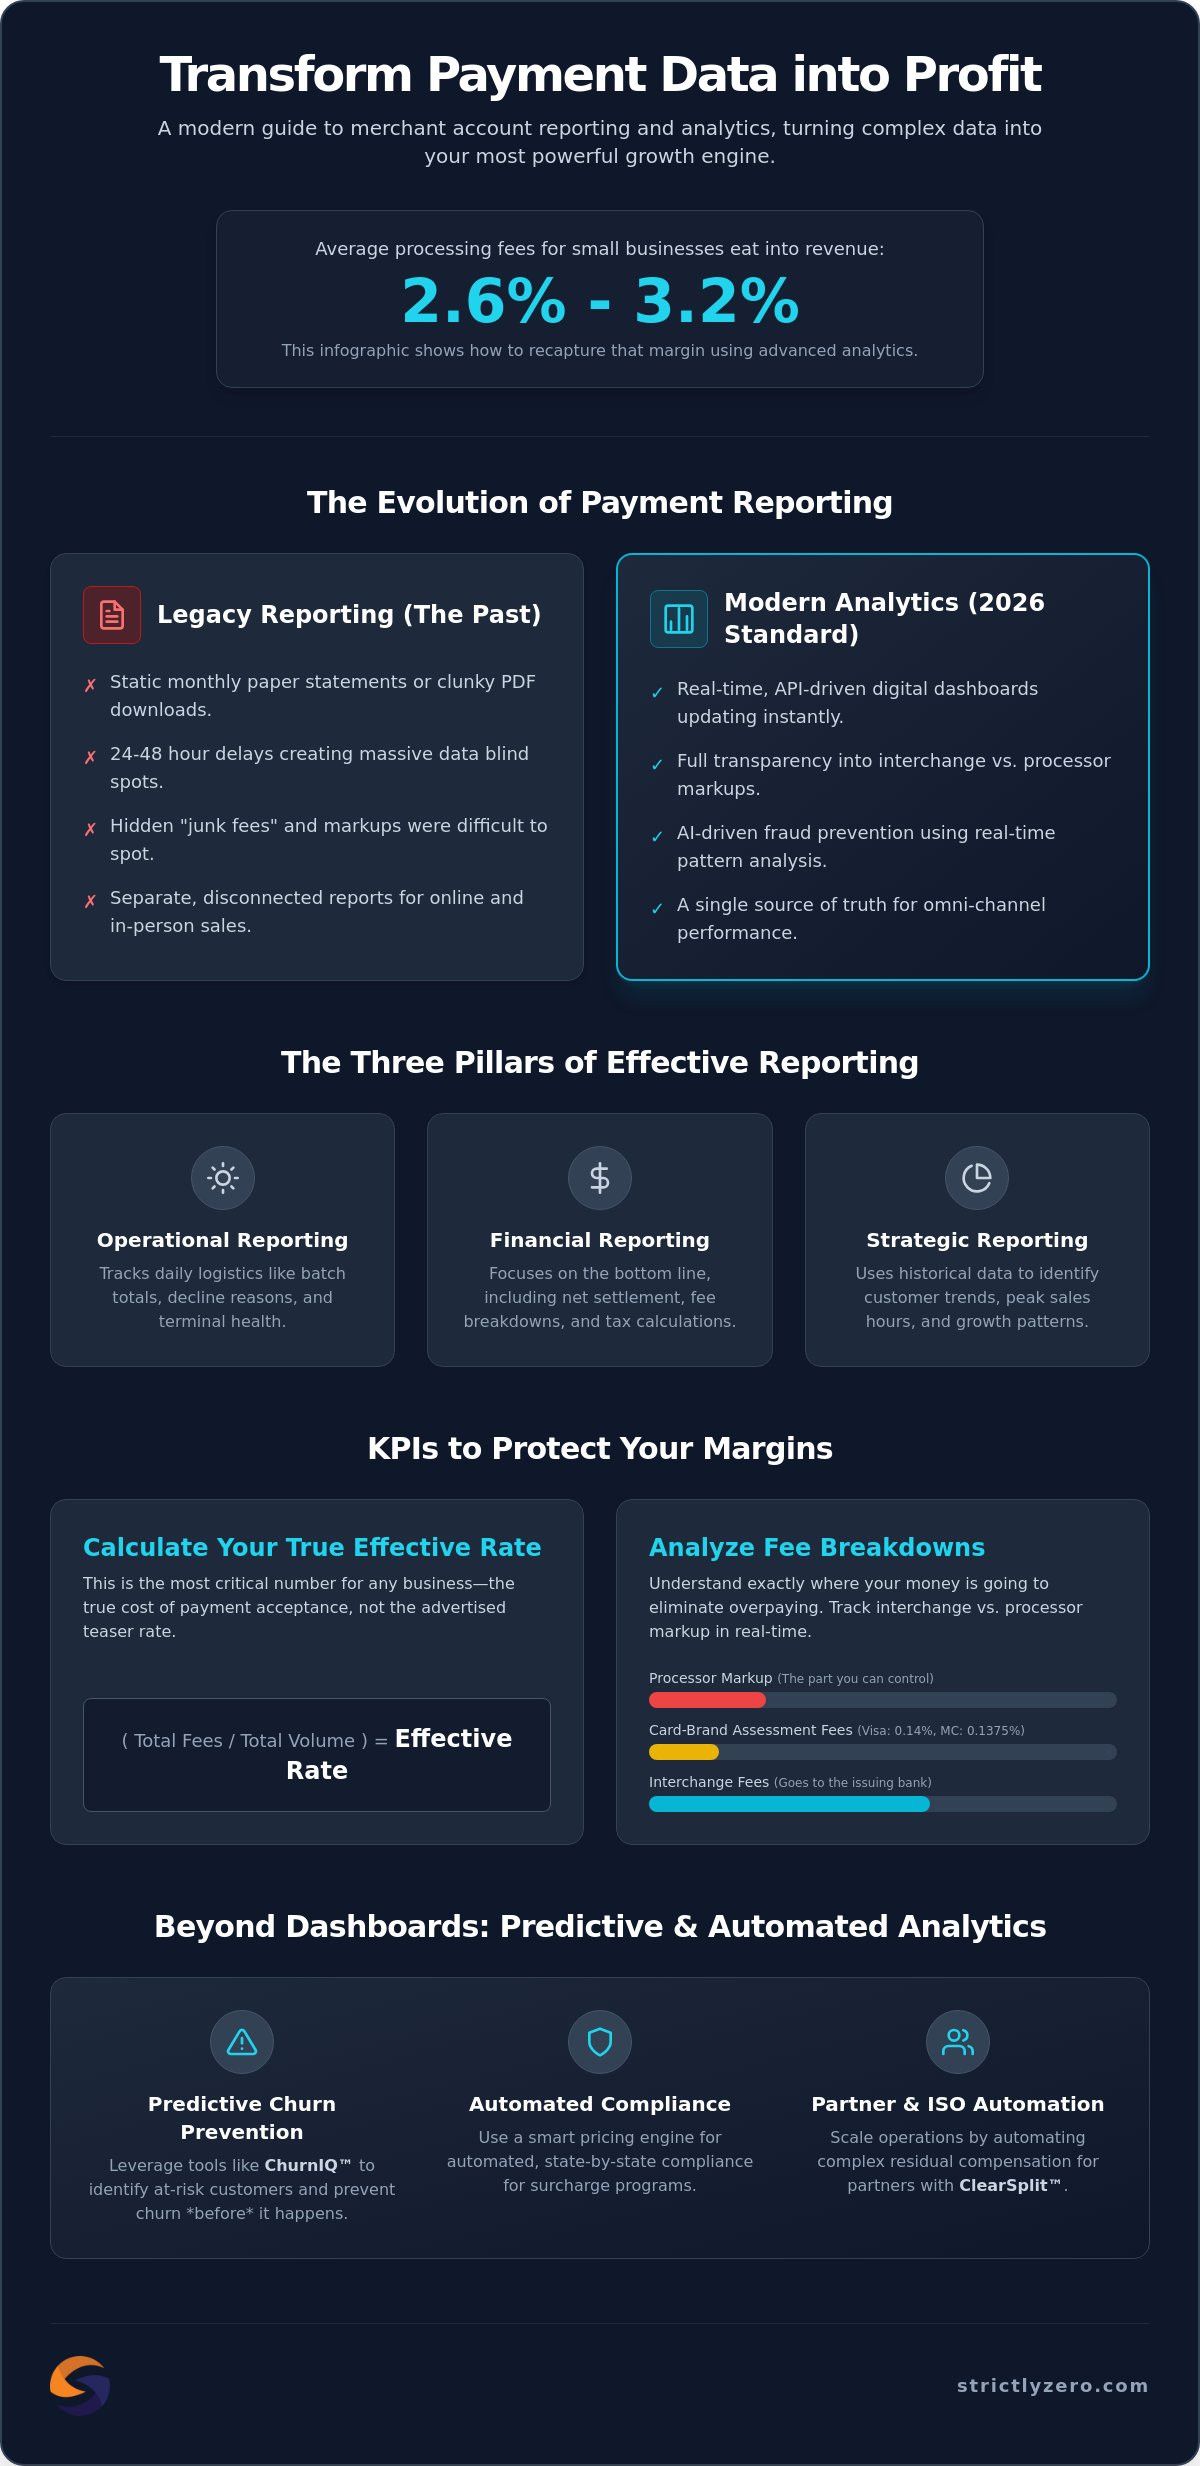
By 2026, the industry has moved far beyond the era of monthly paper statements or clunky PDF downloads. We’ve entered the age of real-time digital dashboards that update with every swipe, tap, and click. This level of transparency is the natural enemy of hidden processing markups. When you can see exactly how much you’re paying in interchange fees versus processor markups in real time, it becomes nearly impossible for providers to slip in “junk fees” or unexplained costs.
To better understand the difference between simply seeing data and actually analyzing it for growth, watch this helpful video:
Effective reporting is built on three distinct pillars:
- Operational Reporting: Tracks daily logistics, such as batch totals, decline reasons, and terminal health.
- Financial Reporting: Focuses on the bottom line, including net settlement amounts, tax calculations, and fee breakdowns.
- Strategic Reporting: Uses historical data to identify customer trends, peak sales hours, and long term growth patterns.
The Evolution of Payment Data
Legacy batch reporting used to create massive blind spots. Merchants often had to wait 24 to 48 hours just to see if a transaction settled correctly. In 2026, the standard is real-time, API-driven data streams. This is especially vital for omni-channel businesses. If you’re selling both online and in-person, you need a single source of truth. Modern merchant account reporting and analytics platforms consolidate these streams, ensuring you don’t have to jump between different portals to understand your total daily performance.
Compliance and Security in Reporting
Reporting plays a critical role in maintaining PCI DSS compliance. Under the current PCI DSS 4.0 standards, you must be able to document your security protocols and transaction logs. Robust reporting helps you identify fraudulent patterns before they become catastrophic. By spotting high velocity attacks or unusual decline patterns in your analytics, you can adjust your AI-driven fraud prevention settings to block high risk transactions without hurting your legitimate sales.
Key Performance Indicators (KPIs) Every Merchant Should Track
Data without direction is just noise. To turn your payment streams into a growth engine, you need to filter your merchant account reporting and analytics through specific Key Performance Indicators. These metrics act as a pulse check for your business, revealing where you’re losing money and where you have the greatest opportunity to scale. If you don’t know your numbers, you don’t know your business.
Financial KPIs: Protecting Your Margins
The most critical number for any business owner is the Effective Rate. This isn’t the teaser rate your processor promised you; it’s the total fees divided by your total processing volume. It’s the only way to see the true cost of acceptance across all card types. In 2026, with Visa assessment fees at 0.14% and Mastercard at 0.1375%, these small percentages add up quickly. You should also track interchange costs versus your processor markup to ensure you aren’t overpaying for the service itself.
Many high volume businesses are now analyzing the impact of zero fee credit card processing on their net revenue. By shifting the cost of acceptance, you can often reinvest that 2.6% to 3.2% average processing fee back into customer acquisition. If you’re curious about how this might work for your specific volume, you can explore our surcharge and dual pricing engine to see the potential savings.
Operational KPIs: Improving the Customer Experience
Operational health is just as important as financial health. You should be tracking your Authorization Rates daily. If your rate drops, it might indicate that your fraud prevention settings are too aggressive, turning away legitimate buyers. Similarly, keep a close eye on your Chargeback Ratio. Staying well below the 1% threshold is vital for maintaining a healthy merchant account and avoiding the “high risk” labels that lead to account freezes.
Robust merchant account reporting and analytics also uncover your churn rate and Customer Lifetime Value (CLV). By identifying why and when customers stop transacting, you can deploy predictive insights to keep them. Focus on these three operational areas to improve the checkout flow:
- Transaction Speed: Slow gateways lead to cart abandonment.
- Decline Codes: Analyze “Do Not Honor” versus “Insufficient Funds” to refine your checkout flow.
- Channel Performance: Compare your mobile conversion rates against in-person sales to identify friction points.
Advanced Analytics: Moving Beyond Static Dashboards
In the past, checking your payment dashboard was like looking in a rearview mirror. You could see where you’d been, but you had no idea what was around the next corner. Modern merchant account reporting and analytics have shifted from descriptive models that simply list what happened to predictive models that forecast what will happen. This transition allows you to move from reacting to yesterday’s losses to securing tomorrow’s wins.
One of the most powerful applications of this shift is in AI-driven fraud prevention. By analyzing years of transaction data, these systems recognize the subtle signatures of high risk behavior before a payment is even authorized. It isn’t just about blocking a bad card; it’s about using historical patterns to protect your merchant account from sophisticated attacks. Similarly, geographic data and heat maps allow you to see exactly where your revenue is coming from. If you’re planning a physical expansion, your payment data can tell you exactly which zip code has the highest concentration of your existing buyers.
Predictive Insights and Churn Management
Omni-Channel Data Integration
Reporting for Surcharge and Dual Pricing Compliance
Surcharging is a high reward strategy, but it carries high regulatory risk. You can’t just add a fee and hope for the best. Specialized merchant account reporting and analytics act as the brain of your program, ensuring every transaction follows local and federal laws. For example, the Durbin Amendment federally prohibits surcharging on debit card transactions. Your reporting must prove that your system identifies debit cards and bypasses the surcharge every single time, even when the card looks like a standard credit card.
In 2026, the regulatory map is complex and constantly shifting. Colorado caps surcharges at 2%, while Illinois implemented a 1% cap effective July 2026. Meanwhile, states like Connecticut, Maine, and Massachusetts prohibit surcharging entirely. A Smart Pricing Engine automates these rules, but your reporting provides the necessary audit trail. This is especially critical with the Illinois Interchange Fee Prohibition Act (IFPA), effective July 1, 2026, which stops interchange fees from being charged on tax and gratuity. Your reports must break down these components clearly to remain compliant and avoid heavy fines.
Auditing Your Surcharge Program
Card brands like Visa and Mastercard conduct regular audits to ensure merchants aren’t overcharging or misapplying fees. Your data is your best defense. You need to show that you’re only surcharging credit, not debit, and that you’re staying within the mandated state caps. It’s also a great time to track customer sentiment. If your dual pricing reports show a massive shift toward cash, you can see exactly how the pricing model affects your conversion rates in real time. If you want to see how these savings look for your business, start your compliant surcharge program today.
Real-Time Fee Offset Analytics
The primary goal of a surcharge program is to reach net zero processing costs. Your daily dashboard should visualize this “Zero Fee” model by showing the gross sale versus the offset amount. Surcharge reporting must distinguish between the sale amount and the service fee to ensure clean accounting and transparent customer receipts. This makes reconciling bank deposits simple, as you can see exactly how the service fees covered the 2.6% to 3.2% average processing costs. By monitoring your debit versus credit mix, you can accurately forecast your monthly savings and adjust your business strategy accordingly.
Strictly: The Future of Payment Intelligence for Merchants and ISOs
Strictly isn’t just another payment processor; it’s a unified intelligence hub designed to solve the data fragmentation that often plagues growing businesses. As we’ve explored throughout this guide, merchant account reporting and analytics are the foundation of modern growth. Strictly brings these disparate data points into a single, intuitive dashboard. Whether you’re managing a single local boutique or a sprawling omni-channel enterprise, the platform scales alongside your ambitions. Its developer-friendly, API-first reporting allows you to pipe payment data directly into your existing business stack, ensuring your financial records are always in sync with your operational reality.
This scalability is particularly vital for businesses moving into the enterprise space. When you have multiple locations, diverse sales channels, and varying state-level compliance needs, you can’t rely on generic tools. Strictly integrates the Smart Pricing Engine discussed earlier directly into your reporting suite. This ensures that every transaction, whether it’s an online order or an in-person tap, is tracked for compliance and profitability automatically. You get a birds-eye view of your entire organization without the manual labor of consolidating spreadsheets.
ClearSplit™: Transparency for Partners
For Independent Sales Organizations (ISOs) and Managed Service Providers (MSPs), the challenge isn’t just tracking sales. It’s managing the network of partners that drive those sales. Providing institutional-grade payment processing for ISOs requires a level of transparency that legacy systems lack. ClearSplit™ eliminates the administrative nightmare of manual residual calculations by automating complex splits for partners and developers in real-time. This reduces administrative overhead and builds long term trust through partner-specific analytics dashboards, allowing ISOs to focus on scaling their portfolios rather than auditing spreadsheets.
Getting Started with Strictly Analytics
Transitioning to a more sophisticated analytics model is a strategic move, not a technical burden. Migrating your historical data into the Strictly platform is a streamlined process, allowing you to maintain a continuous record of customer insights like ChurnIQ™ scores. Once your data is live, you can set up custom alerts for high-risk transactions or unexpected fee spikes. This proactive approach ensures you’re always in control of your margins and your customer relationships. Partner with Strictly to unlock advanced payment analytics today.
Take Control of Your Payment Intelligence
The days of guessing your true cost of acceptance are over. By 2026, the gap between businesses that thrive and those that struggle is defined by their data. You’ve already seen how merchant account reporting and analytics can transform your monthly statement from a passive expense into a strategic asset. By mastering your effective rate and leveraging predictive tools like ChurnIQ™ for customer retention, you stop reacting to market shifts and start anticipating them. Whether you’re an ISO managing partners with ClearSplit™ or a merchant navigating complex state surcharge laws with a Smart Pricing Engine, the right intelligence platform makes all the difference.
It’s time to stop letting hidden fees erode your hard-earned margins. You have the power to turn every transaction into a data point for growth. Eliminate your processing fees and unlock advanced analytics with Strictly today. Your data is ready to work for you; you just need the right tools to listen. Take the next step toward a more transparent and profitable future.
Frequently Asked Questions
What is the most important metric in a merchant account report?
Your Effective Rate is the single most important metric to track. It’s calculated by dividing your total monthly fees by your total processing volume. Unlike teaser rates, this number reveals the true cost of accepting credit cards, including all interchange fees and processor markups. Monitoring this daily helps you spot sudden fee spikes or changes in your card-brand mix that could impact your bottom line.
How often should I review my payment analytics?
You should review your operational data daily and perform a deep dive into strategic trends once a month. Daily checks allow you to catch technical issues like gateway latency or high decline rates before they become expensive problems. Monthly reviews are better for identifying long term trends in merchant account reporting and analytics, such as shifts in customer behavior or the effectiveness of your retention programs.
Can reporting help me reduce my credit card processing fees?
Reporting helps you reduce fees by highlighting exactly where your money is going. By identifying which card types carry the highest interchange rates, you can decide whether to implement a surcharge program to offset those costs. Detailed analytics also allow you to see if you’re being overcharged for non-qualified transactions, giving you the data needed to negotiate better terms with your processor markup.
Is real-time reporting necessary for small businesses?
Real-time reporting is essential for small businesses in 2026 to prevent fraud and manage cash flow. Waiting for a monthly statement means you might not notice a fraud attack or a technical glitch until weeks after it happens. Live data feeds let you respond instantly to suspicious activity, ensuring your merchant account remains in good standing and your daily revenue is protected from unexpected interruptions.
How do I use data to fight chargebacks?
You can fight chargebacks by using your reporting data to provide compelling evidence to the card issuing banks. Advanced dashboards store critical information like IP addresses, CVV matches, and shipping timestamps for every transaction. When a dispute arises, you can quickly pull these detailed records to prove the transaction was legitimate and authorized, significantly increasing your chances of winning the representment process.
What is the difference between a merchant statement and a reporting dashboard?
A merchant statement is a static, historical document issued once a month, while a reporting dashboard is a live, interactive tool. Statements are useful for accounting and tax purposes, but they don’t provide the context behind your sales numbers. Modern merchant account reporting and analytics dashboards offer real-time visualization, allowing you to filter data by channel, location, or customer type to make immediate business decisions.
Can I integrate my payment data with my accounting software?
Yes, most modern payment platforms offer direct integration with popular accounting software through API-first reporting. This automation eliminates the need for manual data entry and reduces the risk of human error. By syncing your payment data, you can automatically reconcile transactions, track sales tax across different jurisdictions, and maintain a real-time view of your company’s financial health without toggling between different platforms.
How does reporting ensure my surcharge program is compliant?
Reporting ensures compliance by creating a verifiable audit trail for every surcharged transaction. Your analytics must document that surcharges were only applied to credit cards and that the fees didn’t exceed state-mandated caps, such as the 1% limit in Illinois. This granular data is your primary defense during card brand audits, proving that your Smart Pricing Engine is operating within both federal and state legal guidelines.