

What if a change in your approval rate points to a channel-specific issue, not a business-wide trend? Payment processing analytics can help answer that question, but a headline number rarely tells the whole story. A dip in approved transactions could reflect differences in sales channels, timing, or transaction context. Those details matter when deciding what to do next.
Payment reports can feel overwhelming. Online, in-person, and mobile transactions may appear in separate views, while teams track metrics without knowing which ones affect revenue, customer experience, or operating efficiency. Looking at the numbers together gives you a clearer starting point for understanding what changed and where to investigate.
This guide explains which payment KPIs are worth tracking, how to compare results across channels and time periods, and how to investigate changes before acting. You’ll also learn a repeatable way to turn findings into practical improvements, from refining payment operations to reviewing fraud patterns. The goal is a manageable set of meaningful measures connected to decisions your team can put into practice.
Key Takeaways
- Payment processing analytics turns transaction and payment-operation data into evidence for better business decisions.
- Start with a focused set of KPIs, then define each measure’s time period, denominator, and reporting source.
- When a metric shifts, segment the results by factors like channel, payment method, customer group, and time before drawing conclusions.
- Use a repeatable review process to investigate changes, choose a practical response, and record what your team will do next.
- Consistent visibility across online, in-person, and mobile payments can make transaction analysis more coherent.
What Is Payment Processing Analytics, and What Can It Help You See?
Payment processing analytics is the analysis of transaction and payment-operation data to guide business decisions. It helps a business look beyond how much it sold and examine what happened as customers tried to pay, which transactions succeeded, and where follow-up may be needed. The aim isn’t to collect more numbers for their own sake. It’s to use payment activity to understand performance and choose a useful next step.
That makes it different from related reports. Sales reporting focuses on purchases and revenue; accounting reconciliation checks that recorded payments match deposits and financial records. Fraud monitoring looks for suspicious activity or risk patterns. Payment processing analytics can draw on data relevant to each of these areas, but its role is broader: to help owners, finance teams, operations leads, and payments managers interpret performance and decide what to investigate or improve.
A basic understanding of how a payment system moves a transaction from customer to merchant can make the data easier to interpret. This video explains key card-processing stages, including authorization, clearing, and settlement:
Useful analytics connect a payment signal to its context, an informed interpretation, and an action someone can take. For example, a change in successful payments is a signal. Comparing results by channel and time may help explain what shifted; reviewing the checkout or payment process is one possible next step.
Which payment data can analytics bring together?
Depending on the reporting setup, a view may include transaction outcomes, sales channels, payment methods, timestamps, refunds, and disputes. Together, these fields help a team ask not only whether a transaction succeeded, but also where, when, and under what payment conditions it occurred. Reports may differ in the fields and level of detail they provide, so check their definitions before combining figures.
Separate reports for online, in-person, and mobile payments can make it harder to assemble a complete business view. A shared view across channels can help teams compare activity using consistent definitions while keeping channel differences visible. That context matters: an overall trend may look stable even as results shift in one part of the business.
What business questions can payment analytics answer?
Teams can use payment processing analytics to investigate questions such as: Did successful payments change, and in which channel? Are customers completing checkout differently by payment method or time of day? Are refunds or disputes concentrated in a particular transaction group? These questions guide investigation without assuming that a single metric reveals the cause.
Payment patterns can also inform cash-flow planning, customer experience reviews, and operational follow-up. For instance, a rise in incomplete or unsuccessful payments may prompt a closer look at the relevant checkout journey, while a change in refunds may help teams identify where service or transaction follow-up is needed. For a grounding in how card acceptance works, see this credit card processing services guide.
Which Payment Processing Metrics Should You Track First?
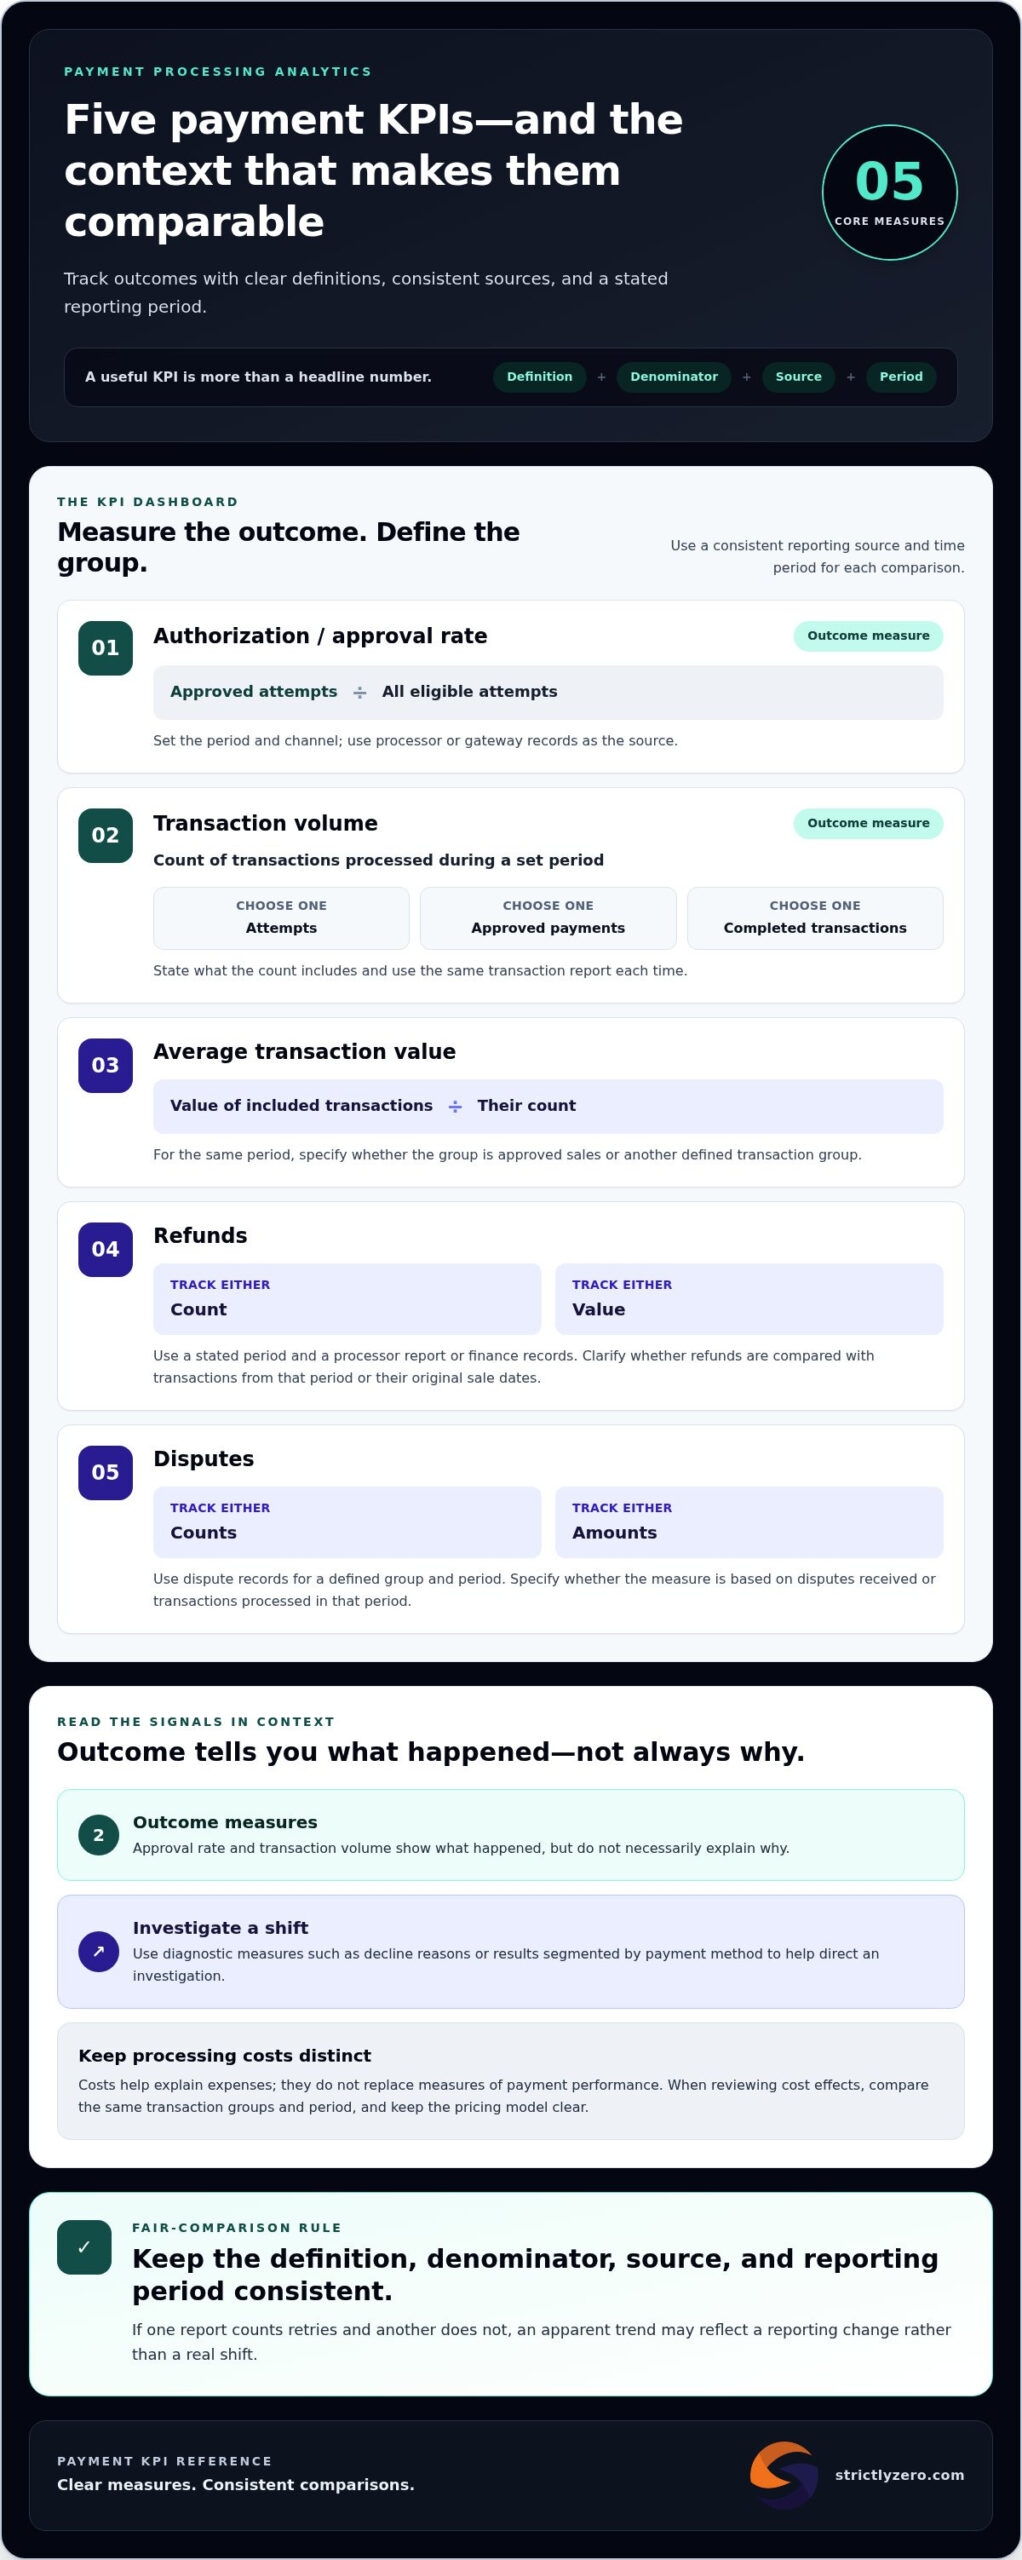
Start with a short list that shows both payment outcomes and the scale of activity. Payment processing analytics is more useful when every KPI has a clear definition, a consistent reporting source, and a time period attached. That makes comparisons meaningful and helps prevent a change in how data is counted from looking like a change in business performance.
- Authorization or approval rate: Approved attempts divided by all eligible attempts, reported for a defined period and channel. Use processor or gateway records as the source.
- Transaction volume: The count of transactions processed during a set period. State whether the count includes attempts, approved payments, or completed transactions, and use the same transaction report each time.
- Average transaction value: The value of included transactions divided by their count for that period. Specify whether you’re using approved sales or another defined transaction group.
- Refunds: Track the count or value of refunded transactions over a stated period, using a processor report or finance records. Clarify whether refunds are compared with transactions from the same period or their original sale dates.
- Disputes: Track dispute counts or amounts for a defined group and period using dispute records. Make clear whether the measure is based on disputes received or transactions processed in that period.
Approval rate and transaction volume are outcome measures. They show what happened, but don’t necessarily explain why. Diagnostic measures, such as decline reasons or results segmented by payment method, can help direct an investigation. Treat processing costs as a separate analysis area: they help explain expenses, but don’t replace measures of payment performance. If you’re reviewing the effect of payment costs, compare the same transaction groups and period, and keep the pricing model clear.
A KPI supports a fair comparison only when its definition, denominator, source, and reporting period stay consistent. If one report counts retries and another doesn’t, the apparent trend may reflect a reporting change rather than a real shift.
How do approval and decline rates differ?
The approval rate is approved transactions divided by attempted transactions in the defined group. The decline rate is declined transactions divided by that same group of attempts. For example, if 100 eligible attempts include 92 approvals and 8 declines, those figures produce the two rates for that example. They aren’t benchmarks. Retries, reversals, and excluded transaction types can change the counts, so document how each is handled before comparing periods.
When should you track refunds, disputes, and payment costs?
Review refund and dispute trends regularly, then look for patterns by channel, payment method, or transaction context. A rise could point to several different issues; the metric alone doesn’t establish the cause. For online and cross-channel comparisons, consistent definitions are especially useful. This ecommerce payment processing guide explores those channel considerations. Businesses seeking consistent visibility across online, in-person, and mobile transactions can also explore omni-channel payment processing.
Why Payment Analytics Numbers Can Mislead Without Context
A dashboard can show that an approval rate fell, refunds rose, or transaction volume changed. It can’t explain the cause by itself. Treating one metric as a diagnosis can send a team toward the wrong fix, especially when the total combines different channels, payment methods, customers, or types of transaction.
Aggregate reporting is useful for spotting a broad movement, but it can hide what’s happening underneath. Imagine online approvals weaken while in-person results improve. A combined rate could appear nearly unchanged, masking a channel-specific issue. Or a shift in payment method mix could change the overall result even if performance within each method stayed steady. In payment processing analytics, the headline is a starting point for investigation, not the conclusion.
Comparisons can also be distorted by seasonality, promotions, store openings, checkout changes, or other business shifts. A busy sales period may bring a different mix of customers and transactions than a quieter one. Comparing periods without noting those differences can make normal variation look like a performance problem or obscure a genuine change. Before interpreting a trend, check that the reporting window, event definitions, and included transaction types match. Consider the number of transactions behind the metric, too. A percentage based on a small group can move noticeably after only a few transactions, so review the underlying count before deciding the change is meaningful.
How should teams segment transaction performance?
Start by reviewing online, in-person, and mobile activity separately, then compare the segments and the combined result. Where the data supports it, break down performance further by payment method, location, time period, or customer cohort. Keep filters and date ranges consistent between comparisons. For example, comparing the same weekday range across periods may be more useful than comparing a full week with a partial one. Record which filters you used so someone else can reproduce the view.
Not every cut of the data needs to become a permanent KPI. Choose a segment that can help answer the question at hand. If the concern is a change in checkout behavior, start with channel and payment method. If the issue appears limited to a location or customer group, investigate that segment next. This keeps analysis focused and makes it easier to identify where follow-up could matter.
How can you tell a signal from a reporting artifact?
Before acting, check whether the metric definition, reporting window, payment integration, or processing flow changed during the period. Confirm that retries, reversals, and excluded transaction types are treated consistently. Then review the transaction count and any business context that could affect the mix. If the data doesn’t support a clear explanation, note what’s uncertain and monitor the same measure using the same rules in the next review.
An aggregate trend shows that something changed, but it doesn’t identify its own cause. The cause becomes clearer only after teams check consistent definitions, examine relevant segments, and connect the pattern to what was happening in the business.
How to Turn Payment Processing Data Into a Repeatable Review
A useful review begins with a decision, not a tour through every dashboard. A repeatable process helps teams use payment processing analytics to investigate a specific issue, check the evidence, and agree on a next step. Keep the routine simple enough to repeat, but detailed enough to show how the team reached its decision.
- Define the question. Start with a business decision, such as whether to investigate a change in online checkout completion. Specify the population, outcome, channel, and comparison window so the team knows exactly what it’s examining.
- Select a KPI. Choose the measure that best reflects the question. Keep its definition, denominator, data source, and reporting window consistent with the comparison you want to make.
- Segment the results. Break the measure down only as far as the question requires, such as by payment method, location, or customer group. Check that filters and time periods match.
- Investigate the pattern. Validate the underlying records and consider relevant operational or business changes. Separate what the data confirms from explanations that are still hypotheses.
- Record an action. Write down the next step, who owns it, and when the team will review the result. The action might be further investigation or a limited operational change, rather than an immediate broad adjustment.
How do you set a useful analytics question?
Make the question narrow enough to answer and act on. Instead of asking, “How are payments performing?”, define a specific population, time window, channel, and outcome, such as whether approved online payments changed for a particular customer group compared with a prior period. This focus helps avoid collecting metrics that don’t inform the decision and gives the team a clear boundary for its investigation.
How should teams document findings and follow-up?
Use a short review note to capture the question, KPI definition, comparison period, segments reviewed, and data source. Record the observed pattern separately from possible explanations. For example, “The measure changed in this segment” is an observation; “a checkout change caused it” remains a hypothesis until supported by evidence. Then note the chosen action, its owner, and a follow-up date.
Before using a report to change staffing, checkout steps, or customer-service procedures, check that records are complete, duplicate or excluded transactions are handled consistently, and the reporting window is correct. If the data has gaps or definitions changed, resolve that first or document the limitation. Otherwise, a team could make an operational change based on a reporting artifact.
Choose a review cadence that fits transaction volume and operational needs. A team handling frequent changes may review relevant measures more often, while a steadier operation may use a less frequent schedule. Keep the rhythm consistent, and revisit it when business activity or payment flows change. At each review, check whether the last action affected the selected measure and decide whether to continue, adjust, or investigate further. For consistent transaction visibility across channels, see omni-channel payment processing.
Connect Payment Analytics to Unified Payment Operations
Payment analysis depends not only on which metrics a team reviews, but also on how transactions move through the business. If online, in-person, and mobile payments follow separate processes, it can take extra work to understand whether a change reflects a real channel trend or differences in how activity is recorded. A more consistent operational foundation can make comparisons easier to interpret while keeping channel-level differences visible.
What role can an omni-channel platform play?
Strictly provides an omni-channel payment processing platform for online, in-person, and mobile payments. Bringing payment acceptance across these channels into one platform gives teams a more coherent starting point for reviewing activity. They can consider the broader transaction picture while still asking focused questions, such as whether a pattern appears online, in person, or across multiple channels.
A shared context doesn’t mean every channel behaves the same way or that every report contains identical fields. Online checkout and an in-person payment involve different customer experiences, so preserve channel distinctions in the analysis. The practical benefit is a clearer operational frame for comparing like with like: teams can examine a specific channel, then relate its performance to the wider business without treating separate processes as unrelated by default.
Payment processing analytics is strongest when the information a team reviews can be connected to the payment activity behind it. A unified processing approach can support that broader workflow, from identifying a change to deciding which part of the operation deserves a closer look. Teams should still use consistent KPI definitions, reporting periods, and transaction groupings when comparing results. The platform provides payment acceptance infrastructure; interpretation and follow-up remain part of the team’s review process.
How can payment insights support retention and risk awareness?
Retention and fraud prevention are important operational considerations, but neither should be mistaken for a single payment-performance metric. A change in transactions or customer behavior may prompt a team to consider whether retention deserves attention. ChurnIQ is Strictly’s merchant retention intelligence tool, designed to support merchant retention efforts.
Fraud prevention is another distinct consideration. Strictly offers AI-driven fraud prevention to help manage fraud risk. Teams can keep risk monitoring in view alongside payment performance without assuming that a change in approvals, refunds, or disputes has one obvious explanation. Each measure needs its own context and investigation.
For a practical review, connect the channel-level pattern to the relevant operational question: Is this a performance change to investigate, a retention concern to understand, or a risk issue that needs attention? Keeping those questions distinct helps teams choose an appropriate follow-up instead of treating every movement as the same problem. Consistent payment operations can provide useful context, but sound decisions still depend on clear definitions and careful interpretation.
Learn how Strictly’s payment processing platform brings online, in-person, and mobile payment acceptance together.
Make Your Next Payment Decision Count
Choose one payment question your team wants to answer next. Set a clear baseline, assign someone to review the evidence, and agree on when you’ll revisit the decision. That small commitment can turn payment processing analytics from a reporting exercise into a habit that helps your business learn and respond.
As those questions evolve, the payment infrastructure behind them matters. Strictly brings online, in-person, and mobile payment acceptance together, with ChurnIQ for merchant retention intelligence and AI-driven fraud prevention as part of its offering. These capabilities address different operational needs, so consider how they fit alongside the measures and review process your team is building.
Explore Strictly’s payment processing platform to plan the next step in your payment operations. Start with one decision, learn from what the data shows, and keep improving your approach with confidence.
Frequently Asked Questions
Is payment processing analytics the same as payment reconciliation?
No. Analytics helps a business understand patterns in payment activity, while reconciliation checks whether transaction records align with deposits and accounting entries. For example, an analyst might examine which payment methods are associated with more declined attempts, while finance staff investigate why a processor payout doesn’t match recorded sales. The tasks can use overlapping records, but they answer different questions and may be handled by different teams.
Can payment processing analytics explain why transactions are declined?
Sometimes. Payment processing analytics can help narrow down possible reasons if the reports include decline codes or other useful transaction details. A cluster of declines could relate to expired cards, incorrect payment information, issuer decisions, or risk controls, but a summary rate alone won’t confirm the cause. Compare the available reason data with the affected channel and transaction group, and treat missing or broad decline categories as a limit on what the report can tell you.
How often should a business review payment processing analytics?
Set a regular review schedule that fits transaction volume and how quickly your team needs to respond. A business with frequent changes to payment activity may review key measures more often than one with steadier operations. Also review outside the routine if a checkout update, new sales channel, or unusual payment pattern raises a specific question. Keep the comparison period consistent so the team can distinguish a lasting shift from a short-lived fluctuation.
Can a small business use payment analytics without a data analyst?
Yes. A small business can begin with processor reports and a simple tracking sheet rather than specialized analysis tools. Record a few clearly defined measures, the date range, and the source of each figure. Add a short note about unusual events, such as a promotion or checkout change, so future comparisons have context. Assign one person to maintain the record and flag questions that need follow-up instead of trying to analyze every available field.
Does payment processing analytics include cash transactions?
Not automatically. Payment processing reports generally cover transactions captured by the payment systems supplying the data, while cash sales may be recorded separately in sales or accounting records. If you want an overall view of revenue, bring cash figures into a separate report and label their source clearly. Keep the distinction visible so cash sales aren’t mistaken for electronic payment activity or included in calculations such as card approval rates.
Why can payment reports show different transaction totals?
Reports may count different stages or categories of activity. One may show payment attempts, while another counts approved or settled transactions. Date boundaries can also differ if one report uses transaction time and another uses settlement time. Refunds, voids, retries, and duplicate records may be included or excluded in different ways. To investigate a mismatch, compare the report definitions and filters first, then check a sample of transaction records against the totals.